ERC Projects Database: Research Tool for Scientists and Research Offices
A clean, filterable database of 12,133 ERC-funded projects that gives proposal writers their funding landscape in seconds.
Last reviewed and updated on 27 October 2026.
Domain Focus: Scientific research funding and impact intelligence
Services: Data engineering and cleaning, information architecture, web development, technical SEO
Tools: Python, Google Sheets, Hugo, GitHub Pages, Claude Code, Google Search Console
Date: September 2026
Live page: pranoti.thesciencetalk.com/erc-projects-database
Executive Summary
Winning a European Research Council (ERC) grant takes precise positioning. Principal investigators and research offices must study the grants already funded in their scheme and panel to show novelty, frame ambition and benchmark a proposal. The data is public, in the European Commission’s Qlik dashboard, but that dashboard is dense, hard to filter and easy to lose your place in.
The ERC Projects Database is a lightweight static page built on a data cleaning pipeline. It turns 238,842 raw data points into 12,133 funded projects from Horizon 2020 and Horizon Europe calls (2016 to 2025). Users filter by call year, grant scheme and scientific domain, and every filtered view has its own URL.
The page HTML went from 4.24 MB to about 157 KB (18 KB gzipped), and search engines can read it.
The Challenge: Data That Is Public but Hard to Use
Before writing an ERC proposal (Starting, Consolidator, Advanced, Synergy or Proof of Concept), applicants need answers to four questions:
- What has the ERC funded in my domain in recent calls?
- Is a funded project already close to my idea?
- Which institutions and countries host funded projects in my scheme?
- How do funded projects frame high-risk, high-gain titles and ideas?
The Qlik dashboard holds the answers, but it gets in the way:
- Information overload. Metrics, tables and charts all appear at once, which buries the project details applicants need.
- Hard filtering. Narrowing by year, scheme and panel domain takes many clicks, and selections reset easily.
- Fragile navigation. Links out to CORDIS can break the search context, so users start their query again.
- No saved views. Selections are not in the URL. Users cannot bookmark a view, share it with a co-applicant or put it in a grant office toolkit.
So many applicants skip this research, or do it superficially, at the stage where it matters most.
Engineering and Design
The database sits between the high-level ERC dashboard and the full project records on CORDIS.
[ERC Qlik export] 13,269 rows, 18 columns
        |
        v
Data cleaning
  - 47 partner rows removed
  - 3,718 "-" placeholders set to empty
  - [PIC,CC] tags stripped from host names
  - whitespace and dates normalised
  - 18 columns reduced to 11
        |
        v
Static page (Hugo, GitHub Pages)
  - first 24 cards rendered in the HTML
  - dataset loaded as a separate cached file
  - filters mirrored in the URL
  - Dataset, CollectionPage, BreadcrumbList structured data
        |
        v
[Live page: about 157 KB, 18 KB gzipped]
1. Data extraction and scope
- Source. I exported 13,269 rows in 18 columns on 21 September 2026, covering Starting, Consolidator, Advanced, Synergy and Proof of Concept grants.
- Time range. I removed the 1,089 projects from the 2015 call, so coverage runs from 2016 to 2025.
- Single-pass ingestion. The Google Sheets API had response-size limits, so I processed one CSV export in a single pass. No rows are lost and no batches can become misaligned.
2. Data cleaning
- Duplicates. A row counts as a duplicate only when every field matches another row. The export had 0. Some different projects share an acronym, so I kept them all.
- Partner rows. Multi-host grants carry a second “partner” row with no acronym, title or funding. I checked each of the 47 against its main record before removing it, so no project was lost and no funding was counted twice.
- Placeholders. The export writes empty cells as “-”. I treated these 3,718 values as empty, which leaves 235,123 genuine data points.
- Host institution fields. Each host name carried an ID and a country code, including inside multi-host cells. I stripped them all. The page reports 943 host institutions, the ERC’s own count, in 35 countries.
- Text clean-up. 750 text fields had stray line breaks or double spaces, and dates needed one standard format.
3. Coverage edge cases
- 2025 Advanced Grants. The first export lacked them because grant agreements were not yet signed. The September 2026 export adds 223.
- 2021 Proof of Concept round. EU databases list it under its legal code,
ERC-2022-PoC1. The data is correct; the label differs from the ERC’s announcement.
4. Only the fields applicants need
I dropped abstracts, region, project numbers and any column the page can derive from the call and panel codes. The final dataset keeps 11 fields (133,463 data points). Each card shows:
- Project: acronym and full title
- Researcher: principal investigator
- Host: institution and country
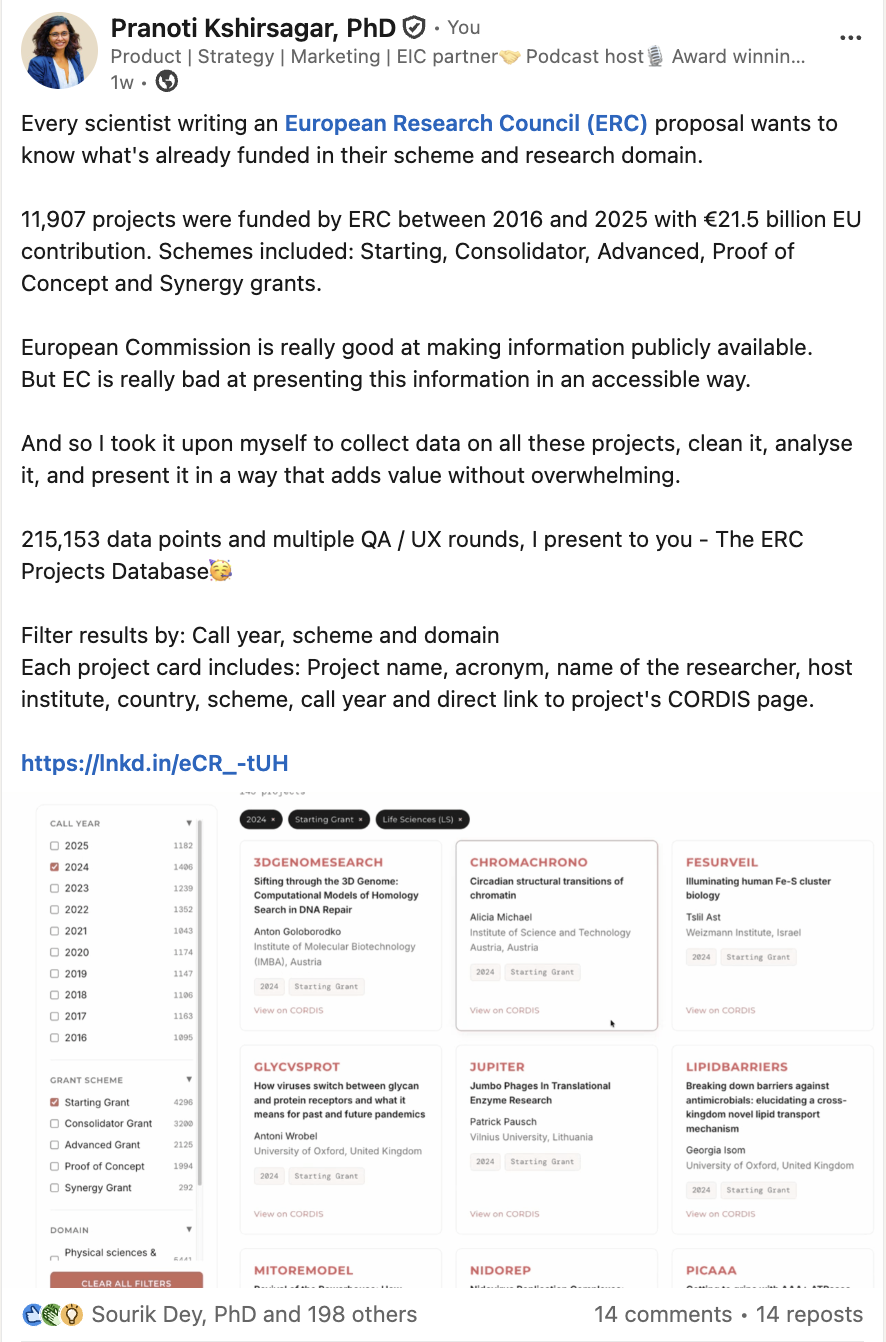
- Call: year and grant scheme
- CORDIS: a direct link to the full record
5. Information design
- Three filters that match how applicants think: call year, grant scheme and domain (Physical Sciences and Engineering, Life Sciences, Social Sciences and Humanities).
- Sorted options. Largest schemes and domains first, newest year first.
- Card grid. 24 projects per page, not thousands of rows at once.
- Shareable URLs. Every filter choice updates the address bar, so a view can be bookmarked or sent to a colleague.
- Context kept. CORDIS links open in a new tab, so the filtered view stays in place.
- Summary strip. €22B in EU contribution (€22,062M), 12,133 projects, 35 countries, 943 host institutions.
6. Speed and search
- Separate data file. The first version embedded the full dataset in 4.24 MB of HTML. The dataset now loads as a separate cached file, and the page is about 157 KB (18 KB gzipped).
- Server-rendered first page. The first 24 projects, with real CORDIS links, are in the HTML, so search engines and AI tools can read them without JavaScript.
- Structured data. Dataset, CollectionPage and BreadcrumbList markup.
- No thin pages. I chose not to generate 12,000+ per-project pages, which would add little for users and weaken the site in search.
Impact
| ERC Qlik dashboard | ERC Projects Database | |
|---|---|---|
| Finding your landscape | Many clicks across a dense dashboard | Three filters on one page |
| Saving or sharing a view | Not possible | Every view has its own URL |
| Search visibility | Content not in the page HTML | First 24 projects in the HTML, plus Dataset markup |
| Data | Partner rows and “-” placeholders | 12,133 projects, 235,123 genuine data points |
| Page HTML | n/a | 4.24 MB reduced to about 157 KB (18 KB gzipped) |
Community response
I announced the database in a LinkedIn post. In one week it got 199 reactions, 14 comments and 14 reposts. The post shows the figures from the first export (11,907 projects and €21.5 billion).
Work With Me
Universities, research institutes and science-driven companies already hold valuable data: grant records, research portfolios, publication lists and impact metrics. Most of it sits in spreadsheets or hard-to-use dashboards.
I’m Dr. Pranoti Kshirsagar. I turn research data into fast, clear, search-friendly tools that give researchers, grant offices and institutional leaders what they need in seconds.
- Focus: research data pipelines, information architecture, scientific web tools, search visibility
- Get in touch: thesciencetalk.com/contact-us
- More case studies: pranoti.thesciencetalk.com/case-studies